Plot that Graph
Graphs are a great way to visualise maths and data. Rust has a nice Crate called plotters that helps you create graphs. Together with the minifb Crate you can then display this graph to the screen.
To help us get started we will plot a classic sine wave graph, open a window and display it to the screen. The window will close if the escape key is pressed or the window close X button is clicked. The graph will also be saved to a .png file so you can import it in to that very important assignment you needed your graph for.
I have commented the Rust code for you to follow through.
The Rust code
// A program to plot a sine wave using the plotters library
// and display it in a window using minifb
// by Rich from https://maths.earth/

use plotters::prelude::*;
use minifb::{Key, Window, WindowOptions};
use std::f64::consts::PI;

fn main() {
    // Define the range and step size for the sine wave
    let x_range = (0..1000).map(|i| i as f64 * 0.01).collect::>();
    let y_values: Vec = x_range.iter().map(|&x| (x * 2.0 * PI).sin()).collect();

    // Plot the sine wave to a PNG file
    plot_sine_wave(&x_range, &y_values).expect("Failed to plot sine wave");

    // Display the sine wave in a window
    display_graph_in_window().expect("Failed to display graph in window");
}

// Function to plot the sine wave using the plotters library
fn plot_sine_wave(x_values: &Vec, y_values: &Vec) -> Result<(), Box> {
    // Create a drawing area for the graph
    let root_area = BitMapBackend::new("sine_wave.png", (640, 480)).into_drawing_area();
    root_area.fill(&WHITE)?; // Fill the background with white color

    // Build the chart with specified configurations
    let mut chart = ChartBuilder::on(&root_area)
        .caption("Sine Wave", ("sans-serif", 50).into_font()) // Title of the chart
        .margin(10) // Margin around the chart
        .x_label_area_size(30) // Space allocated for x-axis labels
        .y_label_area_size(30) // Space allocated for y-axis labels
        .build_cartesian_2d(
            x_values.first().cloned().unwrap()..x_values.last().cloned().unwrap(), // X-axis range
            -1.0..1.0, // Y-axis range
        )?;

    chart.configure_mesh().draw()?; // Draw the mesh (grid lines and labels)

    // Plot the sine wave as a line series
    chart.draw_series(LineSeries::new(
        x_values.iter().zip(y_values.iter()).map(|(&x, &y)| (x, y)), // Data points
        &BLUE, // Line color
    ))?
    .label("Sine Wave") // Label for the legend
    .legend(|(x, y)| PathElement::new(vec![(x, y), (x + 20, y)], &BLUE)); // Legend styling

    // Configure and draw the series labels (legend box)
    chart.configure_series_labels()
        .background_style(&WHITE.mix(0.8)) // Background style of the legend box
        .border_style(&BLACK) // Border style of the legend box
        .draw()?;

    root_area.present()?; // Save the chart to the PNG file
    println!("Sine wave has been saved to sine_wave.png");

    Ok(())
}

// Function to display the graph in a window using minifb
fn display_graph_in_window() -> Result<(), Box> {
    // Load the PNG file and convert it to an RGBA buffer
    let img = image::open("sine_wave.png")?.to_rgba8(); // Open the image file
    let (width, height) = img.dimensions(); // Get the dimensions of the image
    let buffer: Vec = img
        .pixels()
        .map(|p| {
            let [r, g, b, _] = p.0; // Extract the red, green, and blue components
            ((r as u32) << 16) | ((g as u32) << 8) | (b as u32) // Combine them into a single u32 value
        })
        .collect();

    // Create a window to display the image
    let mut window = Window::new(
        "Sine Wave - ESC to exit", // Window title
        width as usize, // Window width
        height as usize, // Window height
        WindowOptions::default(), // Default window options
    )?;

    // Update the window with the buffer content and check for the ESC key press
    while window.is_open() && !window.is_key_down(Key::Escape) {
		// Update the window with the image buffer
        window.update_with_buffer(&buffer, width as usize, height as usize)?;
    }

    Ok(())
}
Cargo.toml
[package]
name = "graph"
version = "0.1.0"
edition = "2021"

[dependencies]
plotters = "0.3.1"
plotters-backend = "0.3.1"
minifb = "0.15.0"
image = "0.23.14"
The image produced:
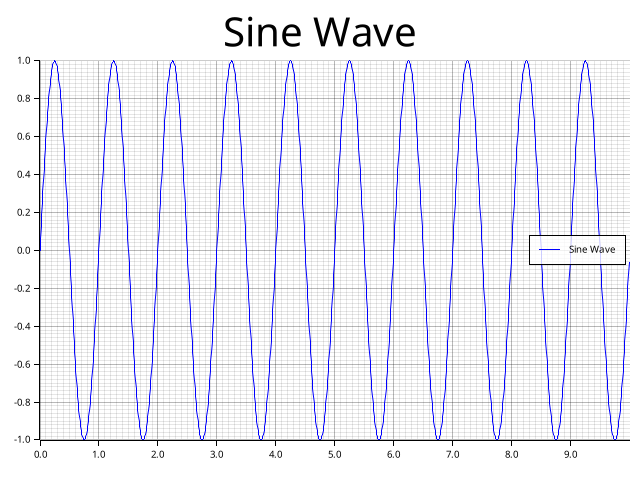
Mission Accomplished
And there we have it, we have a graph on the screen and a graph in a file.